How to Test Object Detection Models#
This guide outlines how to format your object detection data on Kolena, and walks through the steps to easily test object detection models.
Overview of Object Detection#
Object detection is a widely applied computer vision task that aims to locate and identify objects within an image or video, typically with bounding boxes. Object detection has a wide range of applications such as self-driving cars, facial recognition, video surveillance, medical imaging, robotics, and more. Therefore, it is crucial to evaluate object detection models to understand their performance and applicability in any real-world situation.
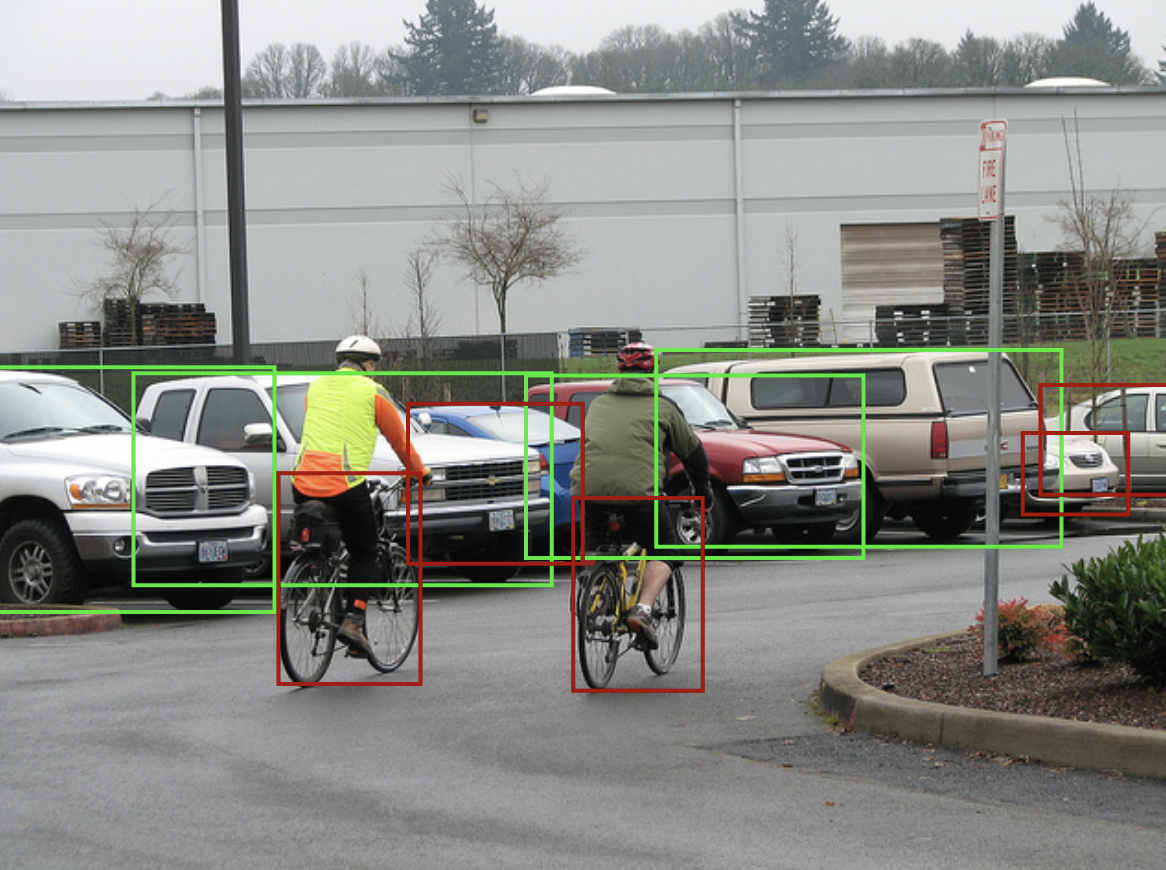
Vehicle detection on an MS COCO image
Examples of Object Detection Datasets
Object detection models require large amounts of annotated data to learn about objects of interest. Some commonly used datasets are: MS COCO, Pascal VOC, Open Images, and ImageNet.
Model Evaluation#
It is important to understand some core performance metrics and plots that are typically seen when evaluating object detection models.
Metrics#
Evaluation of object detection models requires ground truths and model inferences. The ground truths in an image are objects outlined by bounding boxes each labeled with a class. The model inferences for an image are the labeled bounding boxes with confidence generated by a model.
A bounding box matcher aligns an image's ground truths and model inferences to produce TP / FP / FN counts. These counts are fundamental for computing more detailed metrics, which provide insight into the model's performance. Different evaluation configurations can be tuned to filter out model inferences before/after employing a matching algorithm such as filtering out inferences with a low confidence score or ignoring matches where the IoU (the overlap between the ground truth and inference bounding box) is under 0.5.
-
Precision: Precision measures the ratio of correctly detected objects to all objects detected by the model. High precision indicates a low rate of false positives.
\[\text{Precision} = \frac{\text{TP}}{\text{TP} + \text{FP}}\] -
Recall: Recall measures the ratio of correctly detected objects to all actual objects (the ground truths). High recall indicates that the model is good at detecting most of the objects labeled by humans.
\[\text{Recall} = \frac{\text{TP}}{\text{TP} + \text{FN}}\] -
F1-Score: F1-Score is the harmonic mean of precision and recall - a balance of both metrics as one metric.
\[ \begin{align} \text{F}_1 &= \frac {2} {\frac {1} {\text{Precision}} + \frac {1} {\text{Recall}}} \\[1em] &= \frac {2 \times \text{Precision} \times \text{Recall}} {\text{Precision} + \text{Recall}} \end{align} \] -
Mean Average Precision (mAP): Mean average precision (mAP) is obtained by first computing the average precision (AP) for each class based on Precision-Recall (PR) curves and then macro-averaging those scores across all classes. mAP is a comprehensive indicator of a model's performance across multiple categories.
\[ \begin{align} \text{mAP} = \frac{1}{N} \sum_{\text{class}}^{\text{all classes}} \text{AP}_\text{class} \end{align} \]Read the averaging methods guide if you are not familiar with "macro" and "micro" terminology.
Plots#
Plots can become very powerful ways to gain insights into unexpected model behavior, and a formal way to showcase strong model quality. There are several common plots used to analyze the performance of object detection models.
-
Precision Recall (PR) Curves: The PR curve plots precision and recall within a unit square. The greater the area under the curve, the more performant your model is. Typically, there is a tradeoff between precision and recall, which you can read in detail here.


-
Confusion Matrix: Particularly for multiclass object detection, a confusion matrix displays the actual classes against the predicted classes in a table. This allows for a clear understanding of the model's performance with respect to classifying classes.


From the plot above, we can see if the model is confused when detecting cats and dogs.
Note
Any plot suitable for a classification task is also suitable for an object detection task, as object detection is a combination of a classification and localization task. However, it is important to consider what matters to your project and design custom plots to describe your model's performance in the best way possible. For example: an F1-Score vs confidence threshold plot, a histogram of IoUs, or mAP vs different IoUs.
Advanced Plot Insights
For person object detection, it would be interesting to see
how performance differs by different test cases or different characteristics of data. With different lines on
plots representing different groups, such as body part, race, bounding box size, image brightness, etc.
plots easily explain where performance drops.

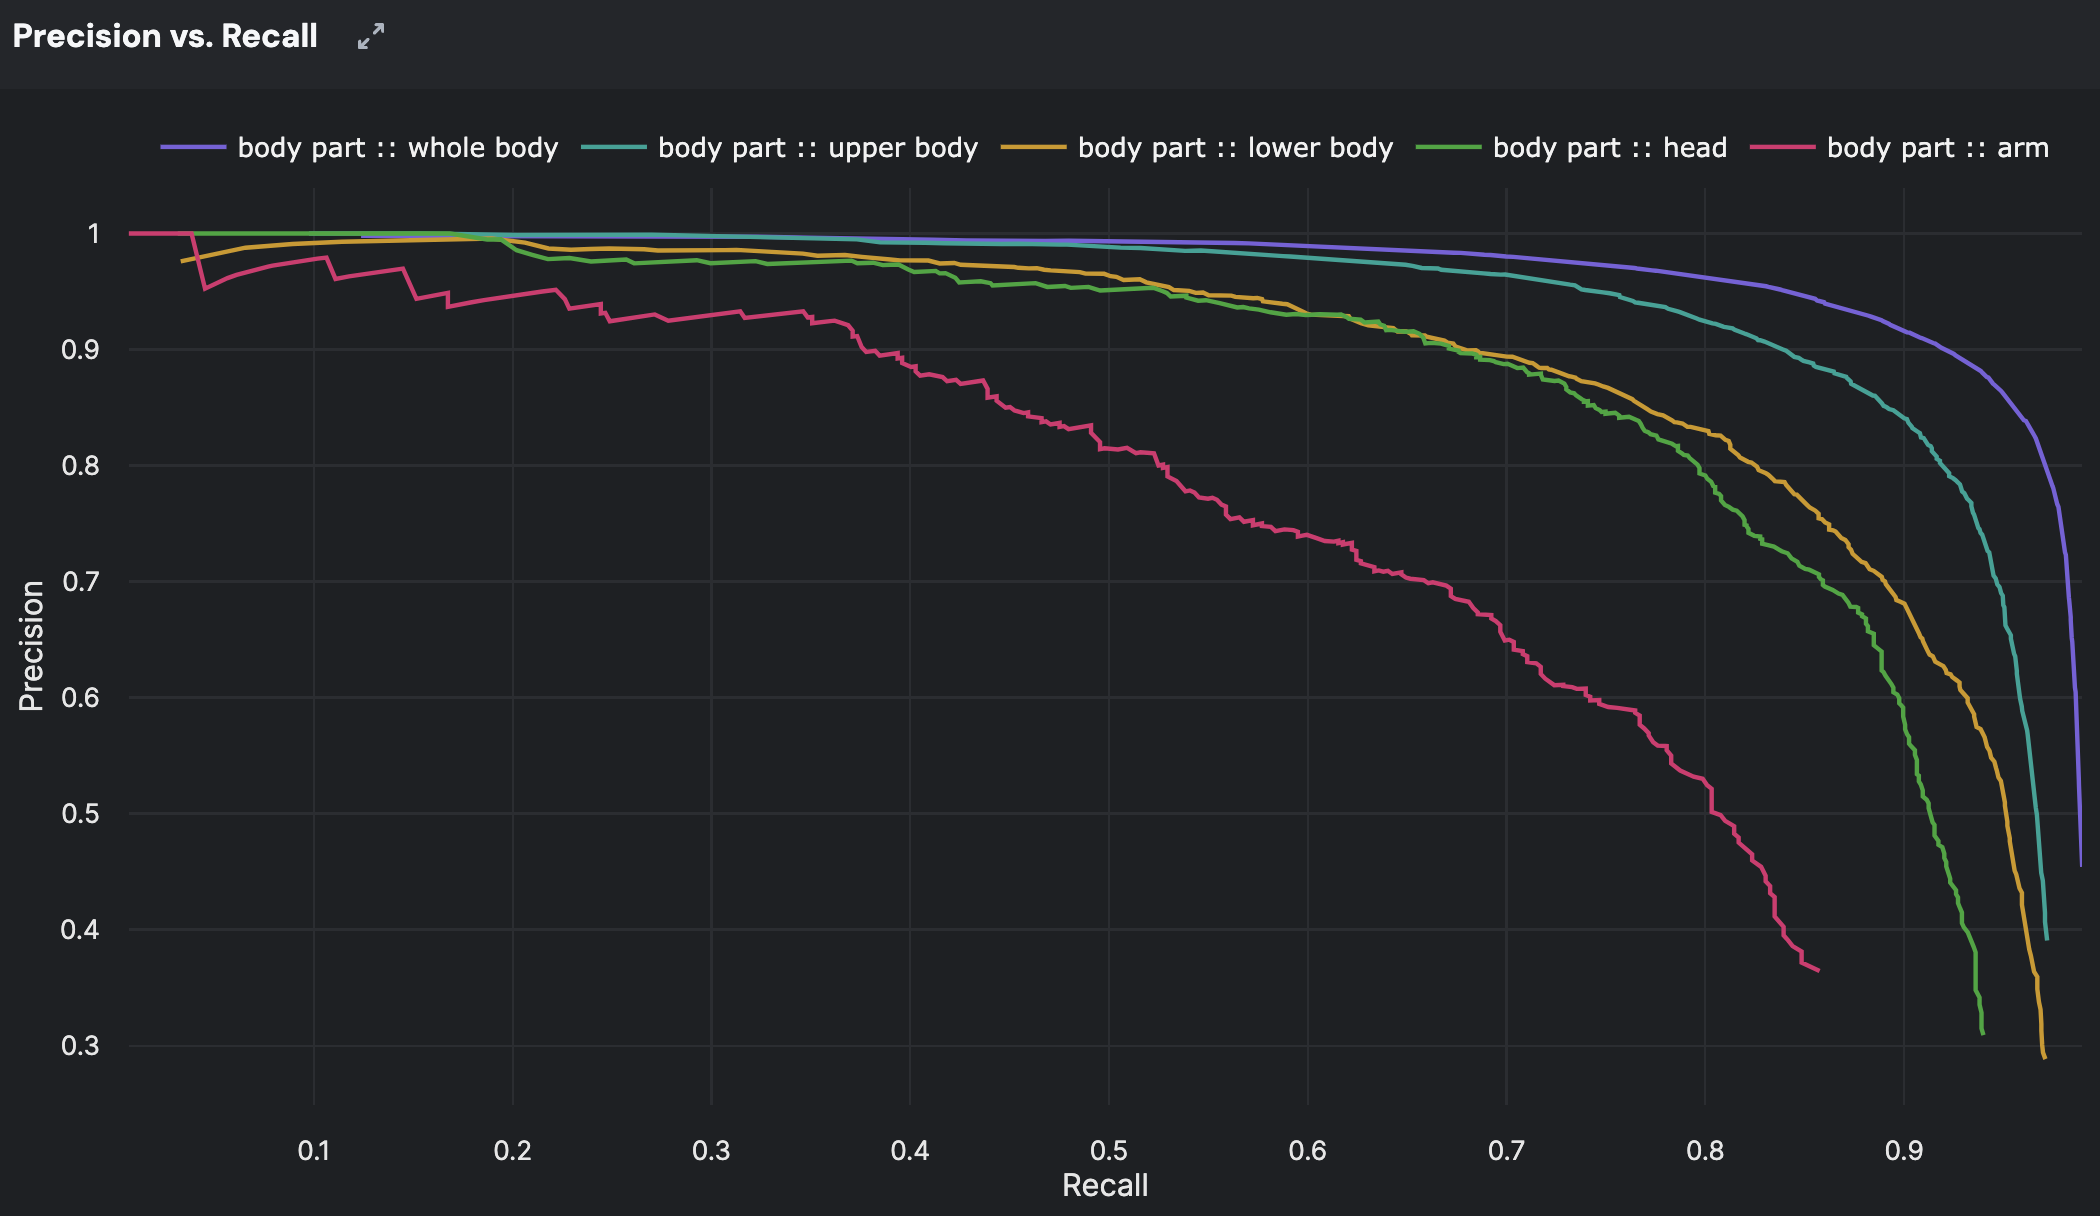
From the example above, we see how a particular model suffers in performance when only a
person's arm is shown.
Using Kolena to Evaluate Object Detection Models#
In this guide, we will use the COCO 2014 dataset to demonstrate test data curation
and model evaluation in Kolena for object detection, using both the web app and the kolena Python SDK.
In the examples below, using the web app will walk you through a single class object detection task,
and following the SDK instructions will demonstrate a multiclass object detection task, just for some variety.
Kolena makes object detection model evaluation very easy in just five simple steps:
Step 1: Format your Object Detection Dataset#
When preparing to upload your object detection dataset, ensure that it conforms to one of the
supported file formats
to guarantee compatibility with Kolena's data processing capabilities (.csv, .parquet, or .jsonl). Kolena
SDK uses pandas Dataframe for data upload.
At minimum, your data should include a
locator which points to
the an image or a video and used as the ID field,
and a ground_truths
column for the dataset's annotations. Additional metadata fields are very useful but optional.
The ground truth column contains list of bounding box annotations, defined using
List[LabeledBoundingBox] from
the kolena SDK. For additional details, see the relevant documentation on
formatting object detection datasets.
See the
object_detection_2d/upload_dataset.py
example script for details on how an object detection dataset can be generated and formatted into a dataset.
Step 2: Upload your Object Detection Dataset#
Model evaluation on Kolena starts with datasets. Upload your dataset of datapoints (e.g. locators to images) with ground truth annotations (e.g. labeled bounding boxes) by importing the dataset file directly within the web app or using the SDK. Extra information can be found on the dataset formatting page.
To upload a dataset, having a properly formatted dataset file is a prerequisite.
To get started, navigate to kolena.com and
click Import Dataset then Select From Cloud Storage.
Using the explorer, navigate to s3://kolena-public-examples/coco-2014-val/
and select coco-2014-val_person-detection.csv. This is a dataset file for person detection using the COCO
dataset.
You will now see a preview of how the information is going to be consumed by Kolena.
Give your dataset a name and select locator as the ID field. The ID field uniquely identifies a datapoint
and is used when uploading model results to associate results with datapoints.
Click Import to create the dataset. Once the import has completed,
you can add descriptions and tags to organize your datasets.


The example code contains a script
object_detection_2d/upload_dataset.py
which will process the CSV file s3://kolena-public-examples/coco-2014-val/transportation/raw/coco-2014-val.csv
and register a small transportation-based dataset in Kolena using the
upload_dataset function.
First, let's first configure our environment by populating the KOLENA_TOKEN
environment variable. Visit the
Developer page to
generate an API token and copy and paste the code snippet into your environment:
We can now register a new dataset using the provided script:
After this script has completed, a new dataset named coco-2014-val will be created
and seen in
Datasets.
Step 3: Format your Object Detection Model Results#
An object detection model will predict the bounding boxes of objects within each image, so there is a list of
inferences per image:
List[ScoredLabeledBoundingBox].
You can either use your own bounding box matcher for relevant metrics by identifying
TPs / FPs / FNs, or you can pass your raw inferences to Kolena's bounding box matcher
using compute_object_detection_results.
For details on what is recommended within your model results, see the relevant documentation on
formatting object detection datasets.
Step 4: Upload Object Detection Model Results#
Note
When uploading model results for object detection, it is generally necessary to use the SDK.
This is because the performance metrics are computed on the client side during the upload process.
Although the Web App can be used as an example, the actual result calculations are performed
via the upload_object_detection function in the SDK.
If any changes are made to the ground truth data, it is important to re-upload your model results to ensure that the metrics are recalculated correctly.
We will upload object detection model results of YOLO X
for a single class object detection task.
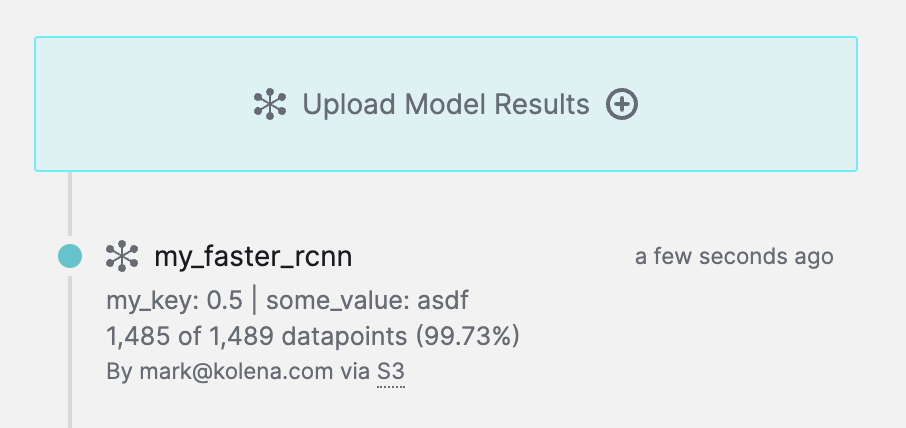
To upload new model results, from the Details tab of the dataset, click on Upload Model Results
in the upper right.
Then, select Upload From Cloud Storage. Using the explorer, navigate to
s3://kolena-public-examples/coco-2014-val/person-detection/results/ and select the yolo_x CSV.
You will now see a preview of how Kolena will ingest the model results. Give your model a name,
and click Import to upload the model results.


You can repeat the above steps with all the other model files availible.
We will upload object detection model results of Faster R-CNN for a
multiclass object detection task.
The example code contains a script
object_detection_2d/upload_results.py
which will process raw model results from s3://kolena-public-examples/coco-2014-val/transportation/results/raw/
and upload model results using the
upload_object_detection_results
function to simplify the process in uploading model results.
For details, see the relevant documentation for uploading object detection model results.
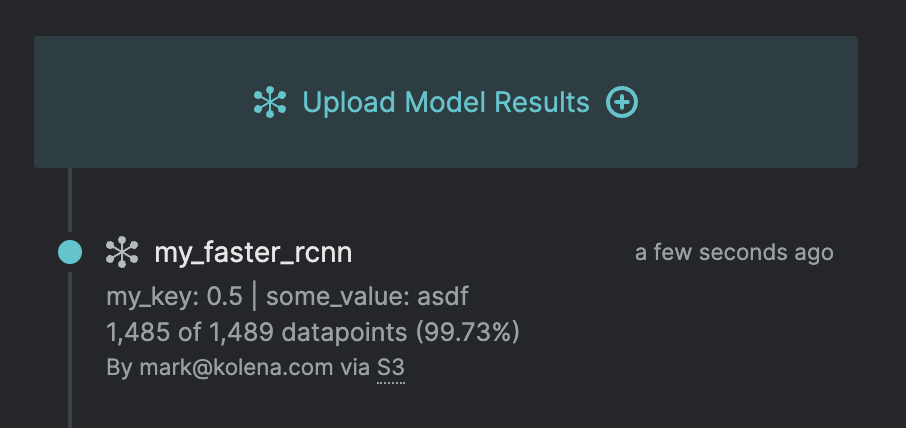
Results for faster_rcnn will appear after the upload is complete.
Step 5: Define Object Detection Quality Standards#
Once your dataset and model results are uploaded, comparing models across different scenarios and metrics becomes very easy. Simply set up your Quality Standards by defining test cases and defining performance metrics.


Setting up object detection Quality Standards
If TP / FP / FN results are uploaded as lists of bounding boxes, Kolena makes it very easy to incorporate relevant object detection metrics.


Configurable metrics for custom Quality Standards
Built-In Object Detection Metrics
Furthermore, Kolena can automatically compute common object detection metrics such as precision and recall, making it easy to visualize an assortment of plots on the fly.


In the debugger, you are able to see plots by class or by test case as shown above. For more details on automatic metrics and plots, please refer to documentation for formatting results.
Evaluating object detection models is a multifaceted process based on the comparison of ground truths and model inferences. Depending on your own project needs, custom metrics and plots can be considered. Kolena makes it easy to understanding and apply evaluation metrics for object detection models to meet the demands of real-world applications.